
A Primer on California City Revenues, Part Two: Major City Revenues
Michael Coleman is principal fiscal policy advisor to the League and can be reached at coleman@muniwest.com. More information on city finance is available at www.californiacityfinance.com. Coleman comments on local government finance topics on Twitter (@MuniAlmanac) and Facebook (www.facebook.com/MuniAlmanac).
Part One, which appeared in the November 2016 issue, examined revenue basics and can be found here.
Major City Revenues
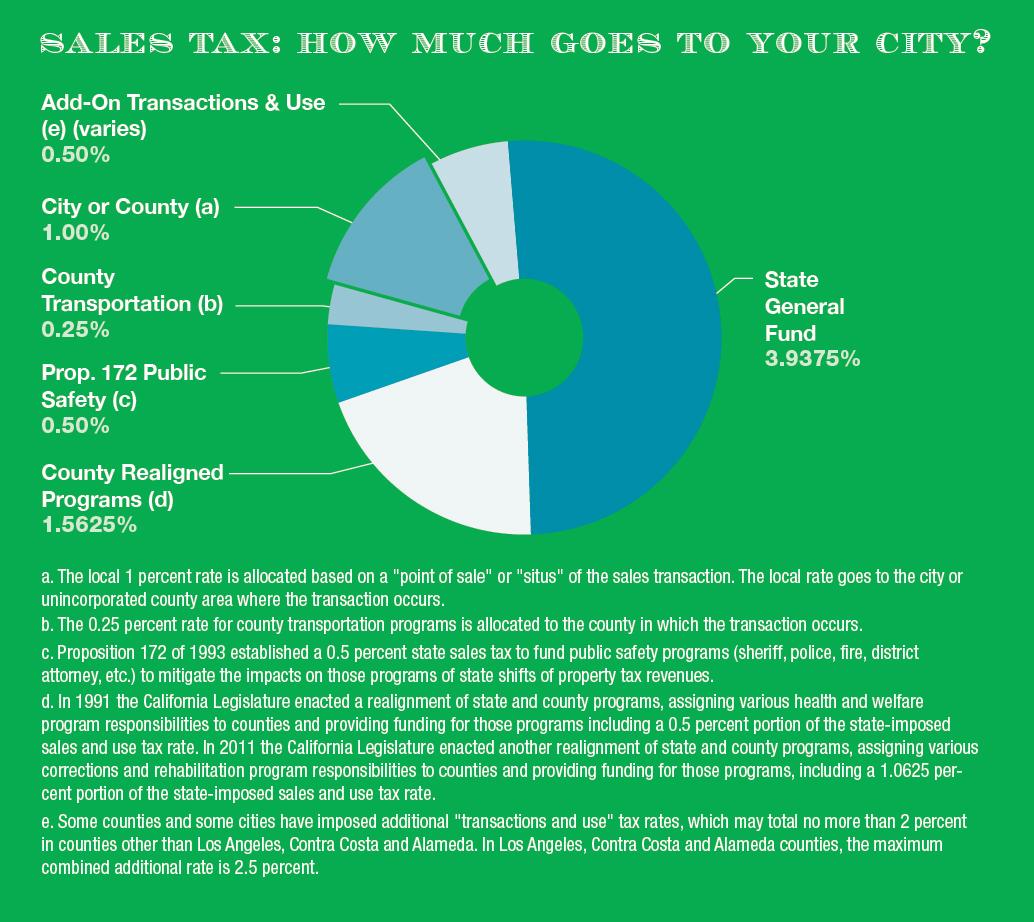
Sales and Use Tax. The sales tax an individual pays on a purchase is collected by the state Board of Equalization and includes a state sales tax, the locally levied Bradley-Burns sales tax and several other components. The sales tax is imposed on the total retail price of any tangible personal property. State law provides a variety of exemptions to the sales and use tax, including resale, interstate sales, intangibles, food for home consumption, candy, bottled water, natural gas, electricity and water delivered through pipes, prescription medicines, agricultural feed, seeds, fertilizer and sales to the federal government. A use tax is imposed on the purchaser for transactions in which the sales tax is not collected.
Although cities vary widely, sales and use tax revenue provides on average 30 percent of city general purpose revenue — and often as much as 45 percent.
Cities and counties may impose additional transaction and use taxes in increments of 0.125 percent with two-thirds city council approval and majority voter approval for a general tax; a special tax requires two-thirds voter approval. The combined rate of the city and county transaction and use taxes is capped at 2 percent in most counties.
Property Tax. The property tax is an ad valorem (value-based) tax imposed on real property and tangible personal property. State law provides a variety of exemptions to the property tax, including most government-owned property; nonprofit, educational, religious, hospital, charitable and cemetery properties; the first $7,000 of an owner-occupied home; business inventories; household furnishings and personal effects; timber; motor vehicles, freight and passenger vessels; and crops and orchards for the first four years. California Constitution Article XIIIA (Proposition 13) limits the property tax to a maximum 1 percent of assessed value, not including voter-approved rates to fund debt. The assessed value of property is the base year value plus the value of any improvements, plus annual inflation capped at 2 percent per year. The base year value is the value at the most recent sale or the 1975–76 market value. Property that declines in market value may be temporarily reassessed at the lower value. Property is reassessed to current full value upon change in ownership (with certain exemptions). Property tax revenue is collected by counties and allocated according to state law among cities, counties, school districts and special districts.
The share of property tax revenue allocated to a city varies depending on a variety of factors, including:
- The service responsibilities of the city (for example, in a city where fire services are provided by a special district, the city receives a lower share, with a portion of the property tax revenues going instead to the special district); and
- The historic (1978) tax rates of the city in relation to other local taxing entities. City property tax revenues are also affected by local property values.
Property Tax in Lieu of Vehicle License Fee (VLF). The VLF is a tax imposed by the state on the ownership of a registered vehicle in place of taxing vehicles. Cities receive additional property tax to replace VLF revenue that was cut when the state permanently reduced the VLF in 2004. This property tax in lieu of VLF grows with the change from the prior year in gross assessed valuation of taxable property in the jurisdiction. Property tax in lieu of VLF allocations is in addition to other property tax apportionments.
Property tax revenue (including property tax in lieu of VLF) accounts for more than one-third of general revenue for the average full-service city. For cities that do not fund fire service, property tax revenue represents on average 25 percent of general revenue.
Business License Tax. Most cities in California levy a business license tax. Tax rates are determined by each city, which collects the taxes. Business license taxes are most commonly based on gross receipts or levied at a flat rate but are sometimes based on the quantity of goods produced, number of employees, number of vehicles, square footage of the business or some combination of factors. In all cases, cities have adopted their tax as a general tax. On average, the business license tax provides about 3 percent of city general revenue and often as much as 6 percent. For businesses that operate in more than one city, state or county, cities can impose a business license tax on only that portion of the business transacted in that city.
Transient Occupancy Tax (TOT) or “Hotel Bed” Tax. More than 400 cities in California impose TOT on people staying for 30 days or less in a hotel, inn or other lodging facility. Rates range from 3.5 to 15 percent of the lodging cost. In nearly all cases, cities have adopted these as general taxes, but some cities make a point of budgeting the funds for tourism or business development-related programs. Among cities that impose a TOT, it provides 7 percent on average of a city’s general revenues and often as much as 17 percent.
Utility User Tax (UUT). More than 150 cities (collectively representing a majority of the state’s population) impose a utility user tax. UUT rates vary from 1 to 11 percent and are levied on the users of various utilities, which may include telephone, electricity, gas, water and cable television. For cities that impose the UUT, it provides an average of 15 percent of general revenue and often as much as 22 percent.
Parcel Tax. This is a special non-value-based tax on property, generally based on either a flat per-parcel rate or a variable rate depending on the size, use or number of units on the parcel. Parcel taxes require two-thirds voter approval and are imposed for a variety of purposes, including police and fire services, parks, libraries and open space protection. Parcel taxes provide less than 1 percent of city revenues statewide.
Rents, Royalties and Concessions. Examples of revenues generated through the use of city property include royalties from natural resources taken from city property, the sale of advertising in city publications, payments from concessionaires operating on city property, facility rentals, entry charges, on- and off-street parking charges and even golf fees.
Franchises. In lieu of rent, franchise fees are collected from refuse collectors, cable television companies and utilities for the use of city streets. Some franchise charges are limited by statute.
Fines, Forfeitures and Penalties. Cities receive a share of fines and bail forfeitures from misdemeanors and infractions committed within city boundaries. State law determines the distribution and use of state-imposed fines and forfeitures, but cities determine penalties for violations of their municipal codes.
Service Charges and Fees. Cities have authority to impose fees, charges and rates for services and facilities they provide, such as plan checking or recreation classes. Use of these revenues is limited to paying for the service for which the fees are collected, but may include overhead, capital improvements and debt service.
Regulatory fees pay for the cost of issuing licenses and permits, performing investigations, inspections and audits and the administrative enforcement of these activities. Examples include a fee to pay for the cost of processing pesticide license applications or a fee to inspect restaurants for health and safety compliance.
City utilities and enterprises supported by service fees constitute a substantial portion of most city budgets. These include water, sewer, electricity and solid waste services. In some cities, a public or private agency other than the city provides and funds these services.
And There’s More
City budgets can be bewildering. Myriad laws and limitations make city funding a very complicated subject. Understanding the essentials of city finance is critical for any city decision-maker. Elected officials find their job is made easier when they are able to explain the basic elements of municipal finance to their constituents.
Responsibilities Differ Among Cities — and Consequently, So Do Budgets
Comparing revenues and expenditures of different cities can be difficult because cities vary according to the needs of their constituents, the nature of the local economy and the city’s service and financial responsibilities. Less than 25 percent of California cities are full-service cities, responsible for funding all of the major city General Fund-supported services such as police, fire, library, parks and recreation and planning. In about three out of 10 California communities, a special district provides fire services with property tax revenue that would otherwise go to the city. In six out of 10 California cities, another public agency provides and funds library services.
Allocations of property taxes among local agencies vary from place to place due to differences in the service responsibilities among agencies serving different areas and differences in the tax rates enacted by those agencies prior to Prop. 13, which passed in 1978. Full-service cities generally receive higher shares than those that do not provide the complete range of municipal services. For example, in a city where fire services are provided by a special district, the city gets a lower share, and a portion of the property tax revenues goes instead to the special district.
Property tax revenues among jurisdictions are also, of course, dramatically affected by differences in the assessed value of properties.
Trends in California City Finance
- State and federal aid to California cities is declining, down from 21 percent of a city’s budget in 1974–75 to less than 10 percent today. Nearly all state and federal aid today is earmarked for specific purposes;
- The sales tax base is declining relative to population and inflation growth, due to the gradual shift toward a service-oriented economy;
- Voter-approved provisions in the state Constitution limit the types, approval procedures and use of local taxes, fees and other charges;
- State population growth is higher in cities than in unincorporated areas;
- Cities must respond to residents’ demand for a greater array of services that bring with them additional costs and new challenges (high tech, cable, transit, pollution control, etc.);
- Spending on police and fire services is up largely due to employee pension and retiree health-care costs; and
- Infrastructure improvements and maintenance are lagging.
Related Resources
California Local Government Finance Almanac, www.californiacityfinance.com
Financial Management for Elected Officials, Institute for Local Government, www.ca-ilg.org/financialmanagement
Public Engagement in Budgeting, Institute for Local Government, www.ca-ilg.org/PEbudgeting
The California Municipal Revenue Sources Handbook, League of California Cities, www.cacities.org/Resources/Publications
Guide to Local Government Finance in California by Multari, Coleman, Hampian and Statler, Solano Press
A Public Official’s Guide to Financial Literacy
Government Finance Officers Association (GFOA) www.gfoa.org/
This article appears in the December 2016 issue of Western
City
Did you like what you read here? Subscribe
to Western City